At the moment, there are no entries available for display


How risk management supports value creation
Risk management enables the Bank to create and protect value by ensuring that growth is well-capitalised, liquid, compliant and operationally resilient – even under adverse conditions. It supports sustainable earnings, preserves stakeholder confidence, and enables the Bank to pursue strategic priorities with discipline.
During 2025, the Bank strengthened the connectivity between risk management and value creation by focusing on four outcomes:
- Protecting earnings quality through stronger credit discipline and provisioning governance;
- Improving capital efficiency and risk-adjusted returns through disciplined pricing and portfolio optimisation;
- Reducing earnings volatility by actively managing market risk and interest rate risk in the banking book; and
- Demonstrated resilience through effective cyclone recovery efforts and support for customers during external shocks, while maintaining strong risk discipline and governance standards.
In practical terms, value creation was supported through:
- Sharper credit governance and earlier action on portfolio vulnerabilities, supported by end-to-end automated impairment solution, enhancing transparency, faster turnaround, improved accuracy, strengthened accountability within our digital ecosystem.
- Embedding risk-adjusted decision-making into pricing and portfolio choices through the Risk-Adjusted Return on Capital (RAROC) framework.
- Maintaining strong liquidity buffers, robust stress-testing and contingency buffers to protect funding resilience and enable lending through the cycle.
- Strengthening operational, cyber and technology resilience through enhanced monitoring, improved incident governance and recognised security certifications to protect customer trust and service continuity.
- Sustaining a strong compliance and conduct environment to preserve stakeholder confidence and franchise sustainability, including implementation of Banking Act Direction No. 5 of 2024 governance enhancements.
- Advancing governance and data readiness for emerging expectations, including AI/ML (Artificial Intelligence/Machine Learning) governance and data quality management.
- Enhancing climate readiness, data quality and model governance to strengthen decision quality, disclosure readiness and access to sustainable finance opportunities.
Risk to value - How risk outcomes support value creation Figure – 66
Risk management supports value creation by protecting earnings quality, maintaining strong liquidity
and capital
buffers, and strengthening operational and cyber resilience. This enables the Bank to serve customers
through the
cycle, meet regulatory expectations, and sustain stakeholder confidence.
In 2025, these outcomes were evidenced through improvements in asset quality and provisioning
strength,
maintenance of liquidity and capital ratios well above minimum requirements, low operational loss
levels,
and strengthened assurance through key security and continuity certifications.
Credit discipline and provisioning governance
Metrics:
- Credit quality – Net impaired loans (Stage 3) to Total Loans Ratio 1.54% (down from 2.76% in 2024)
- Provisioning strength – Impairment (Stage 3) to Stage 3 Loans Ratio 73.50% (up from 64.61% in 2024)
- More stable earnings and lower volatility
- Improved confidence among depositors, investors and regulators
Strong buffers (liquidity and capital)
Metrics:
- Liquidity resilience – LCR/NSFR at 288.58% and 163.94% respectively (well above regulatory minimum)
- Capital strength – Tier I and Total Capital 13.035% and 16.698% respectively
- Capacity to lend through the cycle
- Lower funding cost volatility and stronger market confidence
Market & IRRBB management (earnings/EVE protection)
Metrics:
- Post shock EVE value stood at 2.56% levels, well within internal limits
- Mark to Market (MtM) loss on LKR Government Securities Trading portfolio at 12.97%
- FX sensitivity stood at 82.1% levels
- More stable NII and margins during rate cycles
- Reduced capital volatility from market movements
Operational resilience and
control discipline
Metrics:
- Operational resilience – Operational losses as a % of average gross income 0.132%
- Customer access interfaces operated 24/7 with minimal disruptions, ensuring continuous delivery of high-quality service.
- Improved service continuity and customer experience
- Reduced loss leakage and operational disruption
Cyber/technology resilience and
information security assurance
Metrics:
- Trust and assurance – ISO 27001:2022 and PCI DSS achieved; ISO 22301 in progress
- Detection/response maturity – Managed Security Operations Centre (MSOC) implementation in progress in phased rollout
- Customer trust in digital channels and protection of brand/reputation
- Enables scalable digital growth with stronger security assurance
Compliance, conduct, and data/
model governance maturity
Metrics:
- Conduct and compliance – Zero material breaches/penalties
- Data/model governance – AI/ML Governance Policy and Data Quality Policy implemented
- Sustained stakeholder and regulatory compliance (license to operate)
- Faster, better decisions through stronger data/model discipline
Operating context and risk landscape
Macroeconomic conditions remained broadly stable through 2025, with low inflation and a stable interest-rate environment, supporting recovery momentum. These conditions improved borrower affordability and repayment capacity, particularly across retail and SME segments, and supported credit demand. Tourism activity and earnings strengthened during the year, while worker remittances reached an all-time high, reinforcing household cash flows and supporting credit growth in tourism-linked and remittance-dependent customer segments.
From a banking risk perspective, the stable rate environment reduced repricing volatility and supported more predictable Net Interest Income (NII) dynamics. At the same time, the Bank maintained discipline in interest-rate risk management through active Asset and Liability Management (ALM), robust behavioural assumptions, and ongoing IRRBB monitoring under stress scenarios. Liquidity and funding resilience were supported by stronger FX inflows from tourism and remittances, which contributed to system-wide deposit flows and FX liquidity. Marginal LKR/USD depreciation towards year-end, which increased FX-related valuation sensitivity and reinforced the need for continued monitoring of open FX positions. However, the Bank maintained comfortable liquidity buffers to preserve flexibility and absorb potential short-term shocks.
Externally, the reform environment and evolving expectations from regulators, investors and customers continued to shape the risk agenda. Higher digital activity associated with improved economic momentum reinforced the need for heightened cyber vigilance and enhanced monitoring and response capability. In parallel, regulatory focus areas, including Basel III buffers, Risk and Control Self-Assessment (RCSA), liquidity and operational resilience, cybersecurity, data privacy, AML/CFT and climate-related governance and disclosures, required continued investment in frameworks, controls, and evidence trails, supported by sustained compliance monitoring and staff awareness. A full assessment of the Ditwah cyclone’s impact on the economy, the financial sector and the Bank is still in progress and will be updated as information becomes available.
Please refer to pages 49 to 53 for a detailed account of the Operating Environment and Outlook, which set the context for the year’s performance.
Accordingly, the Bank’s 2025 risk landscape was characterised by seven interlinked themes:
- Credit normalisation with pockets of vulnerability: improving system conditions supported asset quality, while sector- and borrower-specific fragilities continued to require monitoring of early warning signals and targeted remediation.
- Balance sheet sensitivity to repricing and FX movements: a stable rate environment supported predictable NII dynamics, while ongoing repricing behaviour and LKR depreciation towards year-end required active IRRBB measurement and monitoring of open FX positions.
- Liquidity and funding resilience: strong buffers and stress-tested contingency options remained central to maintaining confidence and supporting lending capacity.
- Technology, cyber and third-party risk: an expanding digital footprint increased exposure to cyber threats, system outages and vendor/outsourcing risks.
- Data quality and model governance: increased use of analytics and automation required stronger governance, validation and accountability for model outcomes.
- Environmental & Social (E&S) Risks and Climate Risks: integration into Internal Capital Adequacy Assessment Process (ICAAP) and enterprise risk management became increasingly important for resilience and disclosure-readiness.
- Regulatory, compliance and conduct risk: evolving expectations (AML/KYC, data privacy, consumer outcomes) strengthen continuously.
Governance, accountability and risk culture
The Bank’s risk governance framework is designed to ensure clear accountability, effective challenge and timely decision-making across all material risks. As the highest governing authority, the Board retains ultimate responsibility for risk oversight and sets the tone for prudent risk-taking by approving the Risk Appetite Statement (RAS), key risk policies and capital and liquidity targets. Oversight responsibilities are delegated to Board committees, including Board Audit Committee (BAC), Board Integrated Risk Management Committee (BIRMC), Board Credit Committee (BCC) and Board Strategy Development Committee (BSDC). In 2025, the BIRMC’s charter was expanded to include oversight of climate, cyber, and model risks, enhancing the integration of emerging risks into enterprise risk management.
Risk governance structure Figure – 67
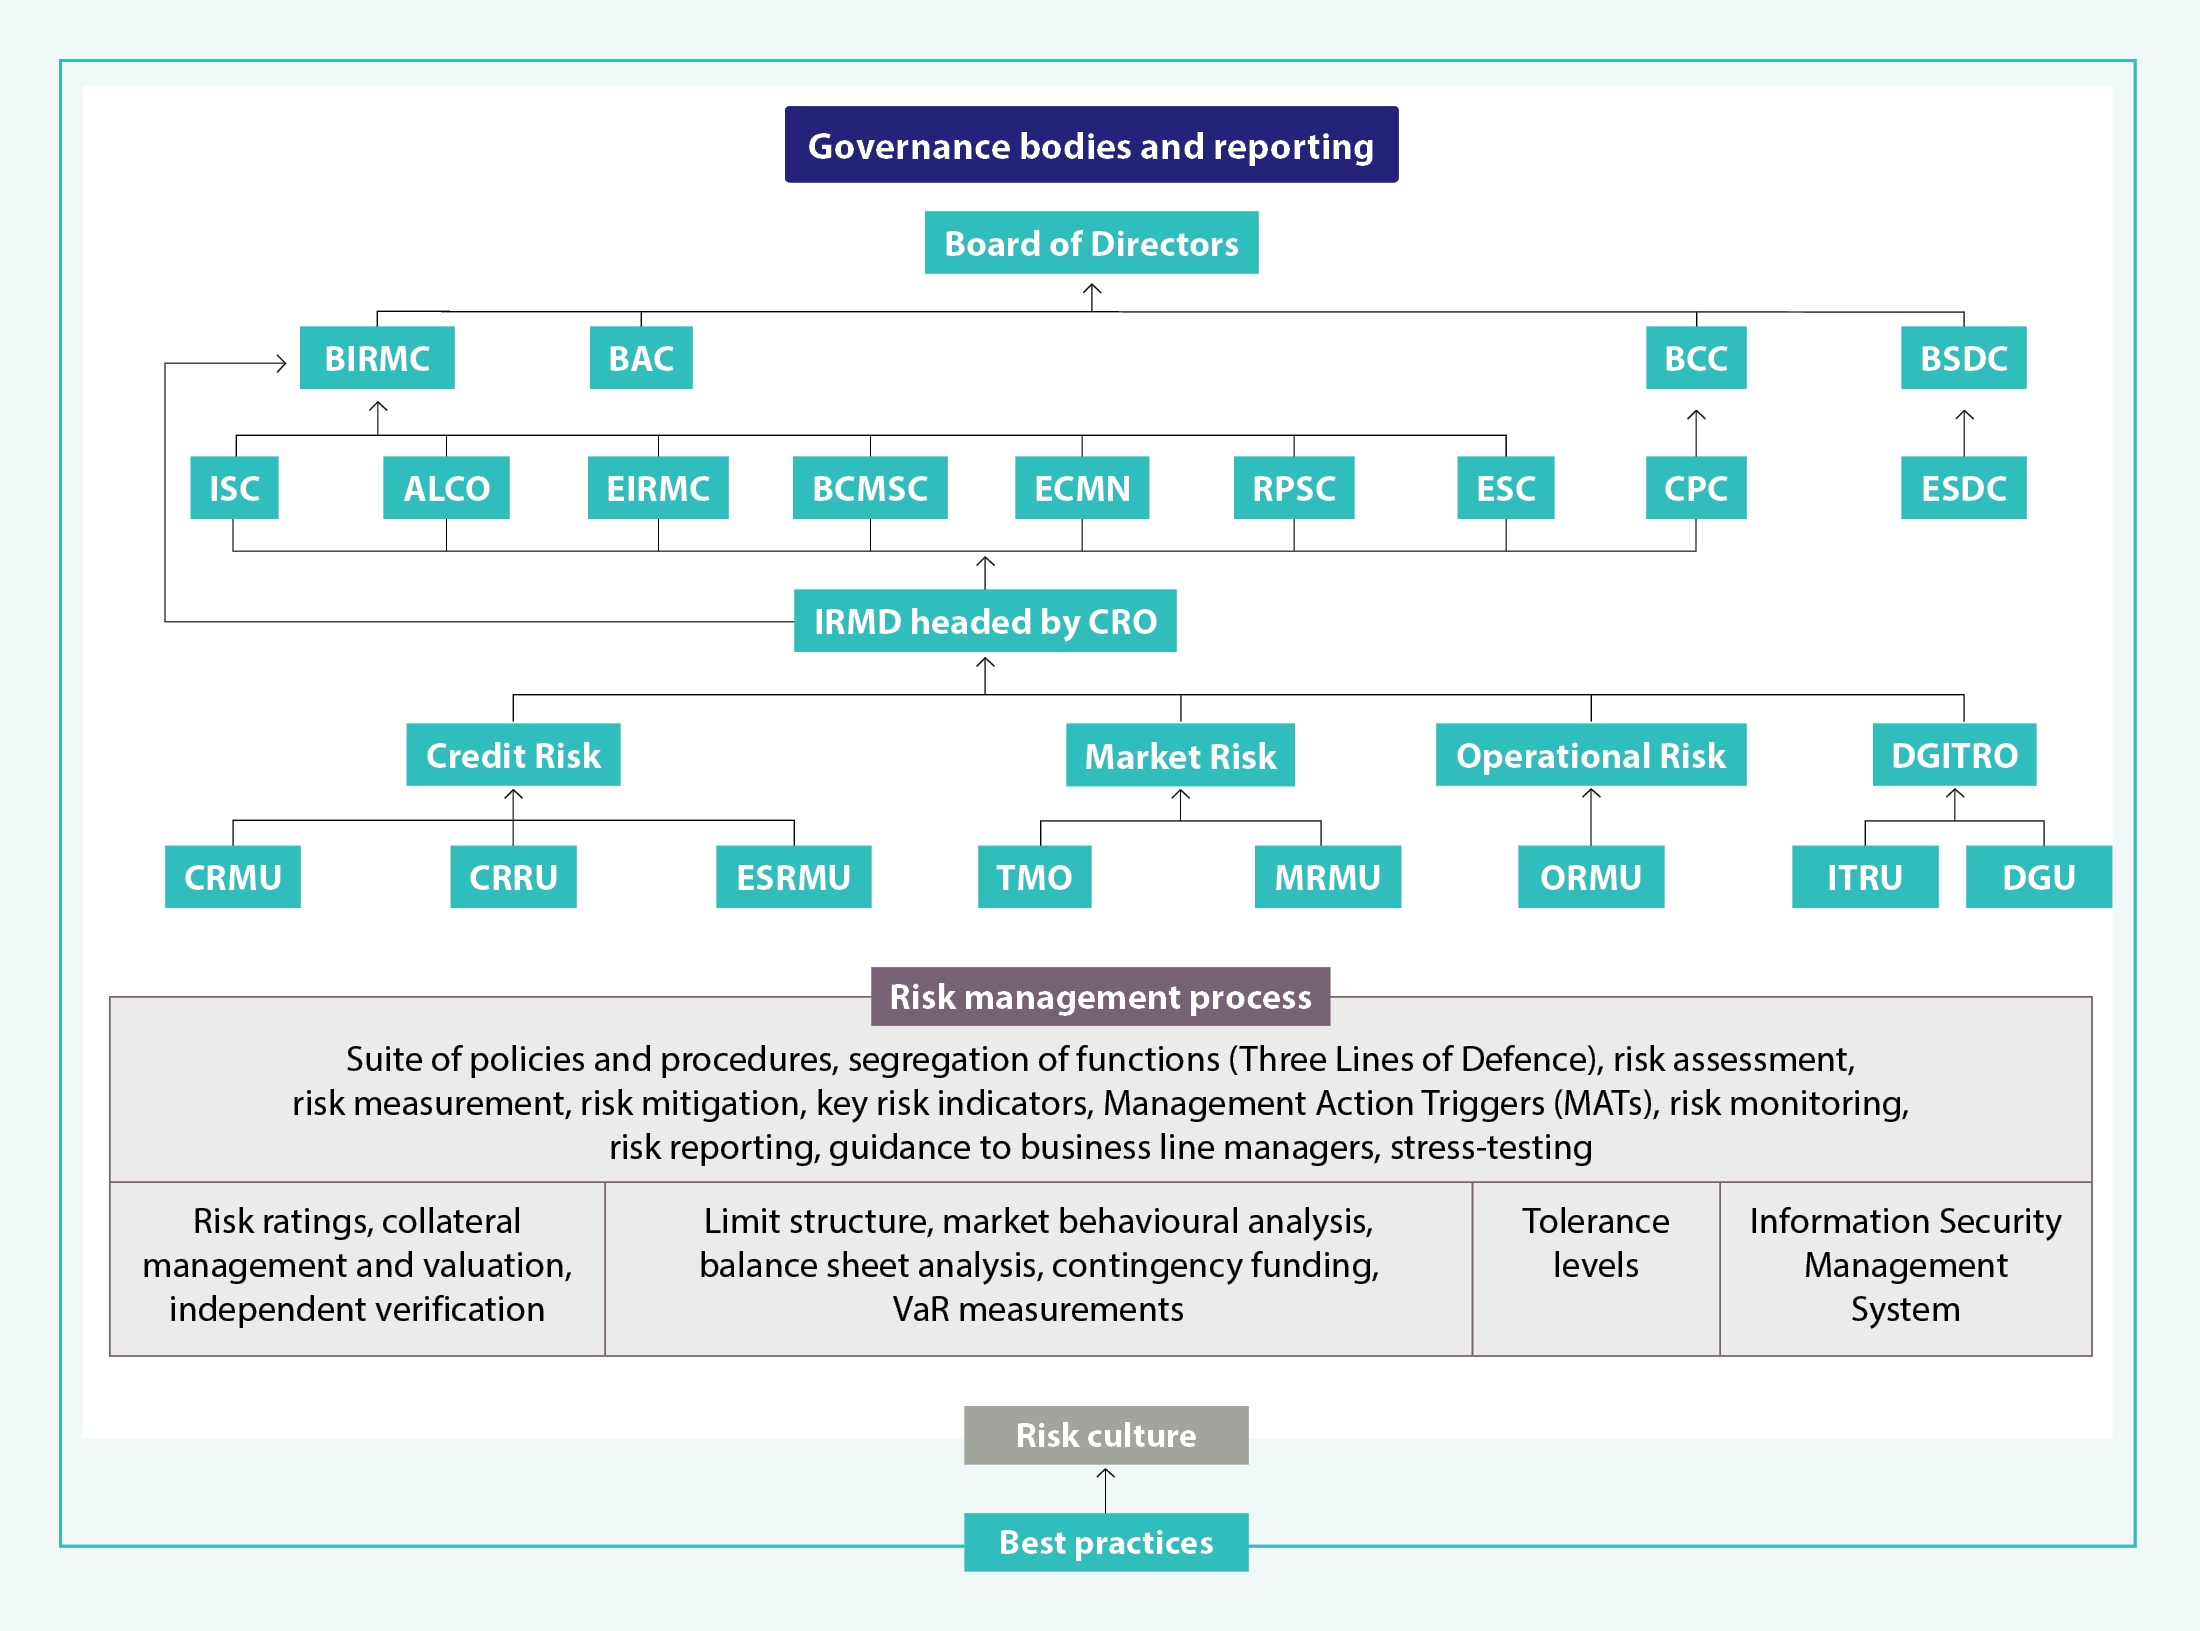
BAC – Board Audit Committee, BIRMC – Board Integrated Risk Management Committee, BCC – Board Credit Committee, BSDC – Board Strategy Development Committee, ISC – Information Security Council, ALCO – Asset and Liability Committee, EIRMC – Executive Integrated Risk Management Committee, BCMSC – Business Continuity Management Steering Committee, ECMN – Executive Committee on Monitoring NPAs, CPC – Credit Policy Committee, ESC – Executive Sustainability Committee, ESDC – Executive Strategy Development Committee, IRMD – Integrated Risk Management Department, CRMU – Credit Risk Management Unit, CRRU – Credit Risk Review Unit, ESRMU – Environmental and Social Risk Management Unit, TMO – Treasury Middle Office, MRMU – Market Risk Management Unit, ORMU – Operational Risk Management Unit, ITRU – IT Risk Management Unit, RPSC – Recovery Plan Steering Committee, DGITRO – Data Governance and IT Risk Office, DGU – Data Governance Unit
Governance is strengthened through a committee structure that enables both holistic oversight and specialist decision-making, through structured monitoring, escalation and remedial actions. At executive level, risk oversight is coordinated through an EIRMC, supported by specialist committees such as ALCO (for balance sheet and liquidity), credit committees (for credit decisions and concentrations), and dedicated forums for operational resilience and technology risk. The Bank further strengthened its technology risk oversight through the Technology Risk Management Committee and the implementation of the Technology Risk Management Framework across identified critical systems and processes.
The Three Lines of Defence model underpins accountability with the first line owns and manages risks within business units and support functions, the second line provides independent oversight and challenge through risk and compliance functions (including the IRMD) and the third line provides independent assurance through internal audit. IRMD independently monitors adherence to policies and limits, coordinates stress testing, supports enterprise risk reporting and provides holistic risk assessments to executive and Board committees.
Three lines of defence Figure – 68
1
st Line of Defence
Business lines/Corporate functions
- Owns and manages associated risks
- Evaluates risk using informed judgment
- Ensures that risks accepted are within the Bank’s risk appetite and risk management policies
- Comprises a robust system of internal controls and an organisation culture of risk awareness which is nurtured with regular training
2
nd Line of Defence
Risk management and control
- Independently monitors effective implementation of risk management framework
- Facilitates high levels of risk awareness throughout the organisation and ensures implementation of the risk management framework
- Maintains a sound risk management policy framework
- Carries out measurement, monitoring and reporting to the Management and Board Integrated Risk Management Committee
- Objectively challenges First Line of Defence
3
rd Line of Defence
Assurance
- Comprises internal audit, external audit and regulatory reviews providing independent assurance to the Board over the First and Second Lines of Defence
- Facilitates high standards of governance and control systems
- Carries out timely reporting of findings to the Management and the Board Audit Committee
Risk culture is reinforced through clear delegation of authority, periodic training and awareness programmes, and the use of consistent risk tools (risk and control self-assessments, key risk indicators, early warning signals, and incident reporting and thematic reviews). Conduct expectations are embedded through policies, training and monitoring, with a low tolerance for misconduct and material compliance breaches.
Integrated Risk Management Framework
The Bank’s Integrated Risk Management Framework (IRMF) provides a structured methodology to identify, measure, monitor and control risks across the Bank and the Group. The framework is reviewed regularly to remain aligned with the operating environment and evolving regulatory expectations.
The IRMF is operationalised through:
- Board-approved risk policies and risk appetite parameters that translate strategy into measurable guardrails.
- Quantitative and qualitative indicators tracked through dashboards and escalation triggers to enable timely corrective actions.
- Independent monitoring and reporting to management and Board committees, enabling challenge and accountability.
- Stress testing and scenario analysis to assess resilience under severe-but-plausible conditions and inform capital/liquidity planning.
- Risk data governance and model validation to support reliable analytics, transparent decisioning and audit-ready evidence trails.
Risk management framework Figure – 69

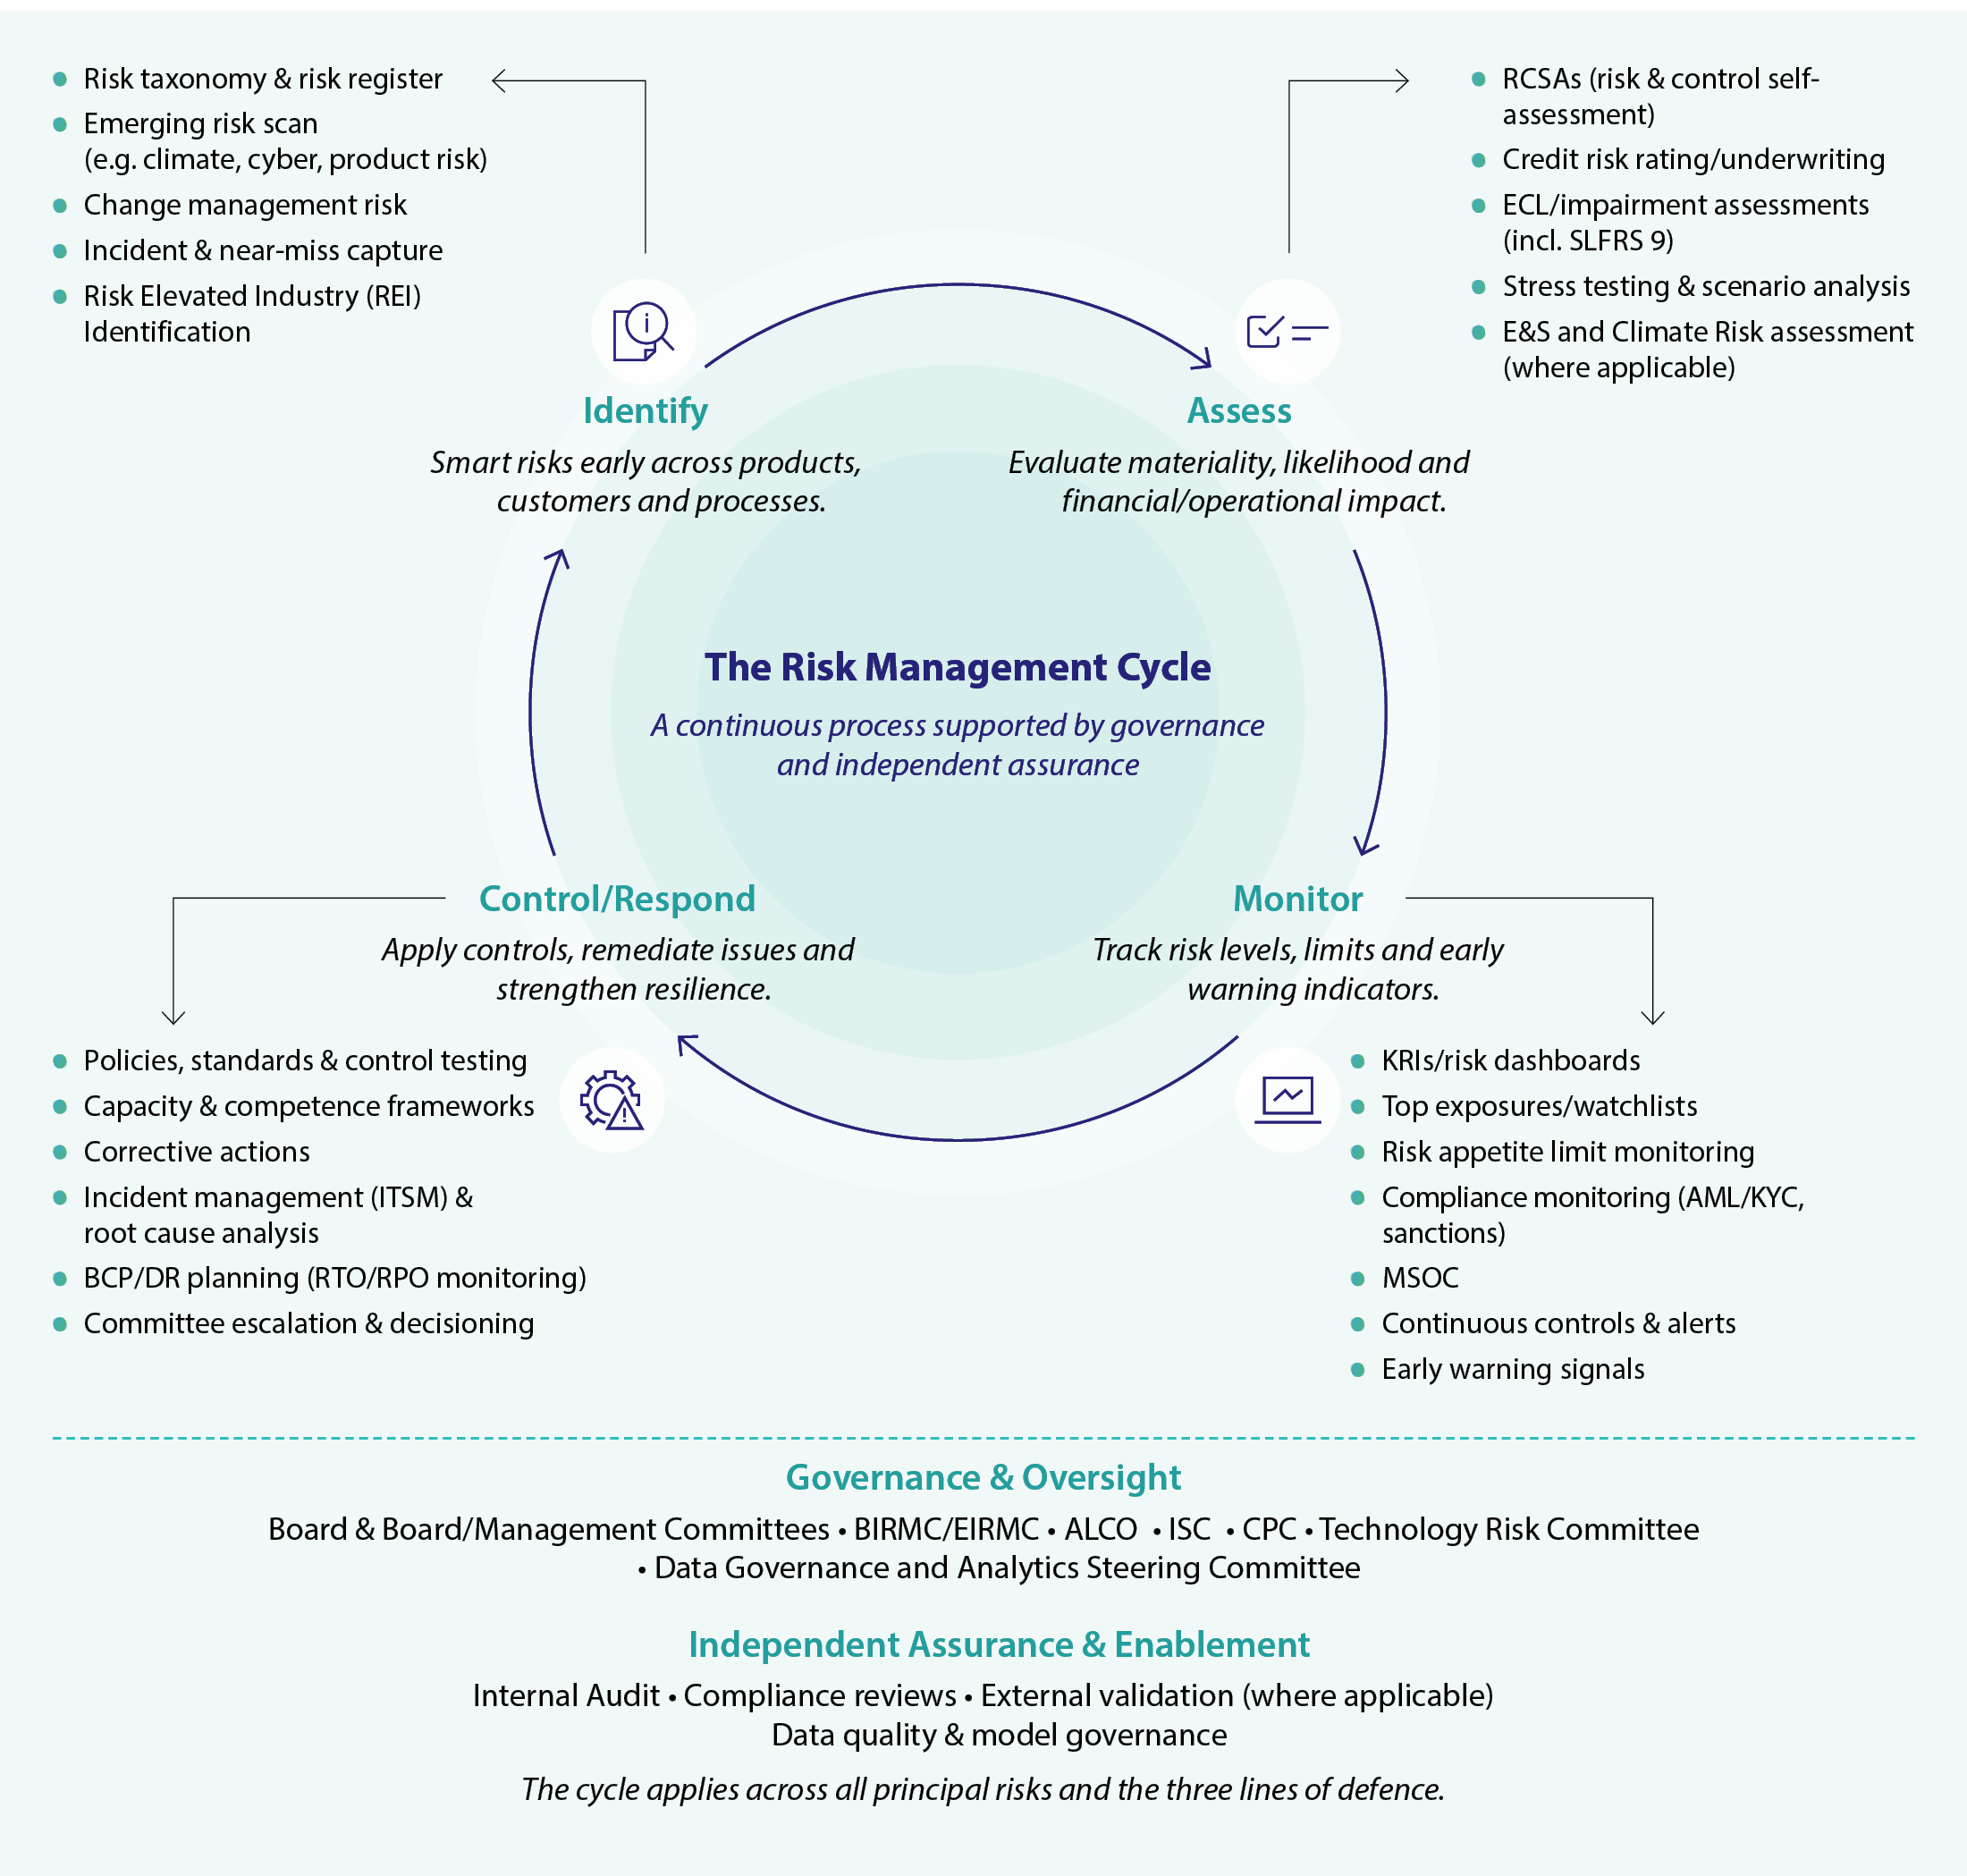
Risk management activities follow a continuous cycle: identify risks (risk registers and thematic assessments), assess and quantify (models, scorecards and scenario tools), monitor (KRIs, limits and early warning signals), and control (policies, approvals, remediation plans and independent assurance). Where risks cannot be eliminated, mitigation focuses on reducing likelihood and impact, transferring risk (for example through insurance) or holding sufficient capital and liquidity buffers.
The Risk Management Cycle Figure – 70
Risk appetite, risk profile and monitoring
The Board-approved RAS defines the boundaries for risk-taking and aligns risk capacity with strategic priorities. It is translated into operational limits, thresholds and qualitative and quantitative guardrails and is reviewed at least annually (and more frequently where warranted). Performance against risk appetite is monitored through key risk indicators (KRIs) and periodic reporting to management committees and the Board.
Risk appetite functions as a value steering tool. By linking appetite to business planning, product design and pricing, the Bank seeks to allocate capital efficiently, avoid undesirable concentrations and maintain resilience. In 2025, connectivity to value creation strengthened through disciplined pricing and portfolio optimisation, strengthened provisioning governance, and continued focus on resilience metrics such as liquidity and capital buffers.
Key risk appetite dimensions include:
- Credit: portfolio quality, concentration limits, large exposure monitoring, and underwriting standards.
- Liquidity: LCR/NSFR targets above regulatory minimums, funding concentration limits, and stress survival horizons.
- Market and IRRBB: sensitivity limits, stress testing results and delegated limits.
- Operational: operational loss tolerance thresholds, incident severity triggers and remediation timeliness.
- Compliance and conduct: low tolerance for material breaches, monitored through compliance dashboards and training completion.
- Technology and cyber: key information risk indicators (KIRIs), Critical System Availability, Governance, Cybersecurity, Change Management, DR/BCP Planning, Third-Party Service Failures.
- Capital & strategic: capital ratio buffers and stress headroom, profitability and rating objectives, and strategic risk triggers linked to the planning cycle.
Risk reporting is designed to be decision-relevant with dashboards highlighting movements vs appetite, key drivers, forward-looking emerging risks and recommended actions. Material deviations or emerging risks are escalated through defined governance forums, with corrective action plans tracked to completion.
Risk profile dashboard
Table – 89
| Principal risk (Appetite and trend as at December 31, 2025) | KRI snapshot (headline + supporting) | Policy parameter | Actual position | |
| 2025 | 2024 | |||
| Credit risk (Within appetite and trend is improving) |
Headline KRIs | |||
| Net impaired loans (Stage 3) to Total Loans Ratio (%) | 2 – 5 | 1.54 | 2.76 | |
| Impairment (Stage 3) to Stage 3 Loans Ratio (%) | 40 – 45 | 73.50 | 64.61 | |
| Supporting KRIs | ||||
| Weighted average rating score of the overall lending portfolios to be better than ‘6’ (%) | 35 – 40 | 80.86 | 80.35 | |
| Product concentration – highest exposure (%) | 30 – 40 | 36.36 | 35.01 | |
| Sector concentration (HHI) | 0.015 – 0.025 | 0.01126 | 0.0111 | |
| Large exposures HHI (>5% capital) | 0.05 – 0.10 | 0.0060 | 0.0067 | |
| Large exposures HHI (>15% capital) | 0.10 – 0.20 | 0.0051 | 0.0054 | |
| Single subsector exposure (% of loans) | 4 – 5 | 2.85 | 2.74 | |
| Aggregate exposures >15% eligible capital (%) | 20 – 30 | 17.17 | 16.88 | |
| Cross-border highest exposure rating (S&P Investment Grade – AAA to BBB-) | AA | AAA | AAA | |
| Liquidity risk (Within appetite and trend is stable) |
Headline KRIs | |||
| LCR (All currencies) (%) | 100 | 288.58 | 454.36 | |
| NSFR (%): Limit/Policy | 100 | 163.94 | 187.29 | |
| Supporting KRIs | ||||
| Foreign currency 03 months cumulative liquidity gap/cumulative liabilities | >20 | Positive | Positive | |
| IRRBB (banking book interest-rate risk) (Near appetite and trend is stable) |
Headline KRIs | |||
| NII sensitivity to a 100 bps parallel rate shock for LKR and 25 bps for FCY (Rs. Mn.) | Maximum of 1,750 |
1,942 | 805.25 | |
| Max repricing gap (RSA/RSL in each maturity bucket up to 1 year) (times) | <1 – 1.15 | 1.02 | 0.84 | |
| Foreign exchange risk (Within appetite and trend is stable) |
Headline KRIs | |||
| Exchange rate shocks on Total FCY exposure (at 1% exchange rate sensitivity) (Rs. Mn.) | 750 | 670.65 | 562.68 | |
| Operational risk (Within appetite and trend is stable) |
Headline KRI | |||
| Operational loss tolerance limit (as a % of last three years average gross income) | 3 – 5 | 0.132 | 0.504 | |
| Supporting KRI | ||||
| Operational Risk Reviews introduced | 10 | 10 | – | |
| Cyber and technology risk (Within appetite and trend is stable) |
Headline KRI | |||
| Critical systems availability | >= 80 | 94 % | 93% | |
| Supporting KRI | ||||
| Planned System downtime for Critical Systems | <10% | <10% | <10% | |
| Compliance, Conduct and reputational risk (Within appetite and trend is stable) |
Headline KRIs | |||
| Conduct Risk Monitoring: Overall Conduct Risk Score (ICAAP) | >85 | 93.94 | 92.42 | |
| Reputational Risk Monitoring: Overall Conduct Risk Score (ICAAP) | >85 | 91.10 | 91.00 | |
| Supporting KRI | ||||
| Compliance audits/reviews across branches and units | 155 | 155 | 136 | |
| Environmental & Social (E&S) and Climate Risks (Within appetite and trend is emerging) |
Headline KRIs | |||
| Climate Risk Monitoring: Overall Climate Risk Score (ICAAP) | >50 | 64.65 | – | |
| Environmental & Social (E&S) and Climate Risks Monitoring: Overall E&S and Climate Risk Score (ICAAP) |
>85 | 90.83 | 90.42 | |
| Supporting KRIs | ||||
| Climate risk tools (heat maps/proxy indicators) and data governance | ||||
| SLFRS S1 and S2 alignment roadmap and disclosure readiness | ||||
| Capital and strategic risk (Within appetite and trend is stable) |
Headline KRIs | |||
| CET1 (%) | Over 8.5 | 13.035 | 14.227 | |
| Total capital (%) | Over 14.0 | 16.698 | 18.142 | |
| ROE (%) | Over 20.0 | 19.51 | 22.06 | |
| Fitch rating | AA(lka) | A(lka) | A(lka) | |
Key risk management developments in 2025
2025 saw targeted enhancements across process digitisation, governance and resilience, supporting both efficiency and stronger control evidence.
Digitisation of impairment assessment and collateral data
To strengthen impairment governance, IRMD deployed a new web-based application for the Individually Significant Customer (ISC) impairment assessment process. This process improved productivity and consistency, reduced manual effort and strengthened auditability and accountability through workflow-based approvals and evidence capture.
Key governance enhancements included improved version control, clearer maker–checker accountability, standardised evidence capture, and a stronger audit trail across key judgement areas (staging rationale, cash-flow assumptions and overlays), supporting more consistent outcomes and faster review cycles.
In parallel, the Bank initiated automation of the property valuation process to improve collateral location tracking and establish a reliable property collateral database. Once implemented, this initiative will enable accurate geo-location tracking of collateral, improve monitoring of concentration and collateral coverage at portfolio level, and support stronger recovery readiness through a more reliable and structured collateral data foundation. The project is currently in the final stage of implementation and is expected to roll over within first quarter of 2026.
These initiatives improve credit decision quality, streamline collateral assignment, strengthen recovery readiness and support more consistent collateral-related controls across the credit lifecycle.
E&S integration and climate risk
Broader E&S and Climate Risks were integrated into ICAAP and the enterprise risk management framework. This integration enables forward looking assessment of portfolio vulnerabilities, strengthens governance, and enhances preparedness for evolving disclosure requirements. Climate risk governance is being progressively aligned with emerging global disclosure expectations (including SLFRS S1 and S2), with ongoing development of supporting policies, processes and data-driven disclosure practices. Oversight is exercised through the Board and relevant Board Committees, ensuring clear accountability across the three lines of defence.
Technology risk oversight, AI/ML governance and data quality
In response to accelerating digitalisation and model-driven decisioning, the Bank established a Data Governance & Analytics Steering Committee to oversee model development and other analytics projects.
The Bank also developed an AI and ML Governance Policy to guide responsible, secure and ethical use of AI/ML tools across business areas.
This policy defines approval, validation, monitoring and control requirements across the model lifecycle, including accountability for model outputs, data access controls, bias/ethical considerations, and evidence trails to
support internal assurance and regulatory confidence. To strengthen the reliability of risk analytics and reporting, a Data Quality Policy was implemented covering data quality dimensions and metrics, alongside roles and responsibilities for data owners, data stewards and data custodians. Improved data availability further strengthened independent challenge by enabling independent reviews of ECL assessments for a wider scope of lending units and by centralising the REI assessment process to improve consistency and accuracy.
Technology Risk Committee developed a Technology Risk Management Framework to enhance oversight of evolving technology risks. The framework strengthens governance over key technology risk domains (including cybersecurity, change management, resilience, third-party/outsourcing risk, data protection and availability), supported by structured reporting and escalation to management and Board committees.
Operational and cyber resilience
The Bank introduced Operational Risk Reviews (ORR) as a thematic initiative to strengthen the internal control environment and accelerate remediation across business units. By supplementing existing RCSA and KRI monitoring, ORRs facilitate deeper analysis of end-to-end processes to identify systemic gaps and recurring root causes, including high-frequency, low-impact events. This proactive approach ensures that common lapses are communicated to stakeholders for continuous improvement, with all remediation efforts tracked to closure through formal governance forums to ensure sustained operational resilience.
Cyber and information security focus continued to strengthen with the phased in implementation of a centralised MSOC to improve real-time detection and response. The MSOC is expected to enhance continuous monitoring across critical systems and digital channels (e.g., cyber threats, unauthorised access attempts, malware activity and information security events), with structured alert review, prioritisation and investigation to support timely mitigation, reporting and management oversight.
In addition, key observations relating to cyber risk, process failures and third-party/outsourcing risks are consolidated and presented through a Key Information Risk Indicators (KIRIs) dashboard to support trend analysis and proactive decision-making.
The Bank achieved ISO/IEC 27001:2022 and PCI DSS certifications, strengthening assurance over key information security and payment environments. Work on ISO 22301 (business continuity) certification also progressed, with the Stage 2 audit planned for early 2026. ISO 22301 readiness was supported by completion of the Stage 1 audit (document review) with no major nonconformities; the Stage 2 audit was rescheduled early 2026 based on auditor availability, with certification targeted thereafter.
Building risk resilience: key initiatives 2025
Table – 90
| Theme | Q1 | Q2 | Q3 | Q4 |
| Credit and portfolio quality | Enhanced Risk Governance Framework for new lending initiatives and cross border lending | Independent Impairment Review of Bangladesh operations, strengthened oversight and governance | Faster impairment workflow, stronger governance and audit trail | Improved collateral location tracking; stronger collateral database |
| Technology and cyber | Operational resilience was strengthened through a comprehensive system downtime analysis of IT incidents | Comprehensive revamp of the IT Risk Management Policy to strengthen cyber detection and response oversight | Strengthened cybersecurity and digital scam prevention and reporting mechanisms to enhance customer confidence in the digital infrastructure | Streamlined IT incident reporting through the implementation of ITSM tools, Strengthened real-time threat detection, identification, and timely response capabilities via MSOC |
| Data/model governance | To strengthen compliance and responsible data management governance, training and awareness programs were conducted for targeted staff handling personal data, processes, and systems | Data Loss Prevention (DLP) controls were implemented to prevent unauthorised sharing of personal data and sensitive bank information | New DLP rules were introduced to improve the quality and consistency of risk reporting Data privacy notice published to explain collection, processing, disclosure and protection of personal data when using Bank’s services, visiting branches, or interacting with digital platforms | To strengthen data integrity, promote responsible reporting, and reinforce stakeholder confidence, comprehensive Data Quality and AI & ML Model Governance policies were introduced |
| Resilience and compliance | Enhanced risk governance framework for Climate risk management | Corporate governance framework were strengthen as per the new CBSL guidelines | Implemented IT and cybersecurity incident reporting requirements to the CBSL Introduced a new Climate Risk Assessment and Management Policy and associated procedures | Implemented Climate risk compliance reporting in accordance with SLFRS S2 disclosure requirements |
Managing principal risks
A summary of the Bank’s principal risks, how they are managed and why they matter to value creation is given below. Detailed quantitative disclosures are presented in dashboards and cross-referenced to Notes to the Financial Statements and regulatory disclosures to minimise duplication.
Summary of risks Figure – 71

Credit risk
Credit risk is the potential for loss arising from a borrower or counterparty failing to meet contractual obligations. It remains a principal risk given the Bank’s role as a financial intermediary and the scale and diversity of its lending and contingent exposures.
2025 performance and developments:
- Asset quality improved during 2025, supported by stabilising operating conditions and enhanced portfolio management discipline.
- Key indicators reported for 2025 included improvements in the Net impaired loans (Stage 3) to Total Loans Ratio to 1.54% (from 2.76% in 2024) and an increase in Impairment (Stage 3) to Stage 3 Loans Ratio to 73.50% (from 64.61% in 2024).
- Open credit exposure ratio improved to 9.17%.
To strengthen early identification over large and complex relationships, the top 20 Group exposures were subject to regular monitoring to detect early warning signals, assess concentration and ensure portfolio stability.
Credit risk is managed through a combination of policy frameworks, delegated authorities, independent review mechanisms, portfolio monitoring and remedial management. Core practices include robust credit underwriting standards, consistent risk grading, concentration limits, collateral governance, and proactive management of early warning triggers.
Key 2025 enhancements and controls:
- Digitised ISC impairment assessment workflow to improve governance, consistency and audit trails for high-impact exposures.
- Collateral data strengthening through the property valuation automation initiative and improved collateral tracking foundations.
- Developed risk controls with AI-powered Underwriting models to ensure decisions remain consistent with policy and appetite. Model governance controls were developed to validate alignment of model outputs with underwriting standards.
- System-driven credit risk rating models introduced for Bangladesh operations to support consistent risk-based decisioning across the Group footprint.
- Regular monitoring of the top 20 Group exposures to identify emerging risks, manage concentrations and trigger proactive actions.
- Embedding RAROC into pricing considerations to support risk-adjusted returns and capital efficiency across products and segments.
Maximum credit risk exposure
Table – 91
| As at December 31, | 2025 | 2024 | ||
| Rs. Bn. | % | Rs. Bn. | % | |
| Net carrying amount of credit exposure | ||||
| Cash and cash equivalents | 84.937 | 2.1 | 86.848 | 2.6 |
| Placements with banks | 103.157 | 2.6 | 104.901 | 3.2 |
| Financial assets at amortised cost – Loans and advances to banks | – | – | – | – |
| Financial assets at amortised cost – Loans and advances to other customers | 1,903.430 | 47.8 | 1,384.525 | 42.1 |
| Financial assets at amortised cost – Debt and other financial instruments | 689.348 | 17.3 | 667.710 | 20.3 |
| Financial assets measured at fair value through other comprehensive income | 217.991 | 5.5 | 301.584 | 9.2 |
| 2,998.863 | 2.545.568 | |||
| Off-balance sheet maximum exposure: | ||||
| Lending commitments | 246.589 | 6.2 | 196.131 | 6.0 |
| Contingencies | 732.840 | 18.4 | 546.359 | 16.6 |
| 979.429 | 742.490 | |||
| 3,978.292 | 100.0 | 3,288.058 | 100.0 | |
| 2,027.759 | 1,486.900 | |||
| Stage 3 (credit impaired) loans and advances to other customers | 128.460 | 127.737 | ||
| Impaired loans as a % of gross loans and advances to other customers | 6.3 | 8.6 | ||
| Allowance for impairment – loans and advances to other customers | 124.329 | 102.376 | ||
| Allowance for impairment as a % of gross loans and advances to other customers | 6.1 | 6.9 | ||
| Impairment charge – Loans and advances to other customers | 22.688 | 22.816 | ||
Provisioning and staging governance
The Bank applies expected credit loss (ECL) approaches consistent with SLFRS requirements. Governance focuses on model performance, overlays where warranted, independent review of key assumptions, and consistent documentation for audit and regulatory scrutiny. The digitised impairment workflow supports stronger control evidence and timely escalation of emerging concerns.
Recovery and remedial management
For higher-risk relationships and stressed sectors, the Bank uses structured monitoring, customer engagement and remedial actions including restructuring where appropriate, enhanced collateral oversight, and recovery strategies. The objective is to minimise losses, preserve value and accelerate resolution while maintaining customer relationships where viable.
Market risk (trading book) and foreign exchange risk
Market risk arises from adverse movements in interest rates, foreign exchange rates, equity prices and other market variables that affect trading and investment positions. Market risk is managed within defined risk appetite limits and regulatory requirements, supported by independent monitoring and escalation.
Market risk categories
Table – 92
| Major market risk category |
Risk components |
Description | Tools to monitor |
Severity | Impact | Exposure |
| Interest rate | Risk of loss arising from movements or volatility in interest rates | |||||
| Re-pricing | Differences in amounts of interest-earning assets and interest-bearing liabilities getting re-priced at the same time or due to timing differences in the fixed rate maturities, and appropriately re-pricing of floating rate assets, liabilities, and off-balance sheet instruments | Re-pricing gap limits and interest rate sensitivity limits | High | Medium | Medium | |
| Yield curve | Unanticipated changes in shape and the gradient of the yield curve | Rate shocks and reports | High | High | High | |
| Basis | Differences in the relative movements of rate indices which are used for pricing instruments with similar characteristics | Rate shocks and reports | High | Medium | Medium | |
| Foreign exchange | Possible impact on earnings or capital arising from movements in exchange rates arising out of maturity mismatches in foreign currency positions other than those denominated in base currency, Sri Lankan Rupee (LKR) | Risk tolerance limits for individual currency exposures as well as aggregate exposures | Medium | Medium | Medium | |
| Equity | Possible losses arising from changes in prices and volatilities of individual equities | Mark-to-market calculations are carried out daily for Fair Value Through Profit and Loss (FVTPL) and Fair Value Through Other | Low | Low | Negligible | |
| Commodity | Exposures to changes in prices and volatilities of individual commodities |
Mark to market calculations | Low | Low | Negligible | |
Management approach:
The Bank monitors trading exposures primarily through sensitivity measures, supported by a robust governance framework and stress testing. Foreign exchange and fixed income trading positions are MtM, governed by sensitivity limits, and any exceptions are escalated through defined governance channels.
Foreign exchange risk is managed within Board-approved limits and regulatory boundaries. Oversight includes monitoring of net open positions, stress testing and sensitivity analysis, and ensuring sufficient liquidity in foreign currency where relevant to meet obligations and support customer needs.
Sensitivity of Net Interest Income to rate shocks
Table – 93
| Net Interest Income (NII) | 2025 | 2024 | ||
| Parallel increase Rs. ’000 |
Parallel decrease Rs. ’000 |
Parallel increase Rs. ’000 |
Parallel decrease Rs. ’000 |
|
| As at December 31, | 1,941,933 | (1,942,803) | 805,254 | (806,045) |
| Average for the period | 896,742 | (897,559) | 830,956 | (831,385) |
| Maximum profit/(loss) for the period | 1,941,933 | (1,942,803) | 1,461,243 | (1,461,840) |
| Minimum profit/(loss) for the period | 233,446 | (234,328) | 152,547 | (152,674) |
Interest rate sensitivity gap analysis of assets and liabilities of the Banking Book
Table – 94
| As at December 31, 2025 – Bank | |||||||
| Description | 0-90 days Rs. ’000 |
3 to 12 months Rs. ’000 |
1 to 3 years Rs. ’000 |
3 to 5 years Rs. ’000 |
More than 5 years Rs. ’000 |
Non-sensitive Rs. ’000 |
Total Rs. ’000 |
| Total financial assets | 1,252,819,294 | 435,654,493 | 443,091,736 | 468,269,267 | 315,203,273 | 142,281,295 | 3,057,319,358 |
| Total financial liabilities | 1,548,857,107 | 764,524,542 | 197,966,454 | 56,453,787 | 9,872,060 | 259,112,884 | 2,836,786,834 |
| Interest rate sensitivity gap | (296,037,813) | (328,870,049) | 245,125,282 | 411,815,480 | 305,331,213 | (116,831,589) | 220,532,524 |
| Cumulative gap | (296,037,813) | (624,907,862) | (379,782,580) | 32,032,900 | 337,364,113 | 220,532,524 | – |
| RSA/RSL | 0.81 | 0.57 | 2.24 | 8.29 | 31.93 | 0.55 | 1.08 |
Market risk - key metrics and controls
MtM impact for 100bps rate shock on Gov. Securities Trading Portfolio (FVTPL):MtM impact for 100bps rate shock on Gov. Securities Trading Portfolio (FVTPL):
- Maintained an average sensitivity utilisation of 61% and contained MtM loss utilisation to just 12.97%.
Trading book risk remained within Board-approved limits; elevated days were reviewed and explained.
Key controls:
- Close monitoring of MtM, sensitivity and market yields
- Independent valuation/price verification
- Escalation and management review for limit breaches
FX Sensitivity/Net Open Position:
- Proactive management ensured the Net Open Position (NOP) stayed well within regulatory limits, and FX sensitivity at 1% was closely monitored and averaging 82% of the approved threshold.
Exposure managed within limits; late-year LKR movement reinforced monitoring of open positions.
Key controls:
- Intraday/daily NOP limits and monitoring
- Stress scenarios and sensitivity analysis
- Hedging/escalation protocols
Investment Valuation Risk: Gov. Securities Trading Portfolio (FVOCI):
- Average sensitivity utilisation stood at 66%. The portfolio operated profitably, with no utilisation of the MtM loss threshold.
Valuations reviewed regularly; portfolio risk monitored for volatility and concentration.
Key controls:
- Independent valuation and governance
- Concentration limits and periodic portfolio review
- Sensitivity/stress testing of investment book
Interest rate risk in the banking book (IRRBB)
IRRBB reflects the sensitivity of the Bank’s earnings and economic value to movements in interest rates. As the interest rate environment evolves, disciplined IRRBB management supports stable margins and sustainable profitability.
IRRBB is assessed through stress testing and scenario analysis from both Economic Value of Equity (EVE) and Earnings at Risk (EAR) perspectives. In 2025, scenario analyses included rate shocks in the range of 100–400 basis points for LKR and 25–100 basis points for foreign currency, supporting ALCO decision-making on pricing, tenor strategy and balance sheet positioning. ALCO oversight ensures that changes in market rates, behavioural assumptions and product repricing characteristics are appropriately considered.
Risk drivers typically include the repricing gap between assets and liabilities, the behaviour of non-maturity deposits, prepayment characteristics, and the optionality embedded in certain products. Robust governance therefore requires both quantitative measures and qualitative challenge of key assumptions.
IRRBB – EAR sensitivity under interest rate shocks (EAR/NII)
Key management levers ALCO uses to manage IRRBB Figure – 72
Pricing discipline:
Loan and deposit pricing actions to manage spreads and repricing risk.
Tenor/mix:
Adjust tenor and repricing mix of assets and liabilities to reduce gaps.
Deposit behaviour:
Monitor and refine behavioural assumptions for non-maturing deposits.
Hedging:
Use permitted hedging actions and limits, supported by governance and effectiveness review.
Liquidity risk and funding resilience
Liquidity risk is the potential inability to meet obligations as they fall due without unacceptable losses. It is inherent in banking due to the very business model of financial intermediation and maturity transformation and is managed through strong buffers, diversified funding, and stress-tested contingency options.
2025 position:
- LCR (All Currencies): 288.58%
- LCR (Rupee): 419.40%
- NSFR: 163.94%
Key ratios used for measuring liquidity under the stock approach
Table – 95
| As at December 31, | 2025 | 2024 |
| Liquidity ratios | ||
| Loans to customer deposits | 0.78 | 0.66 |
| Net loans to total assets | 0.58 | 0.50 |
| Purchased funds to total assets | 0.24 | 0.24 |
| (Large liabilities – Temporary Investments) to (Earning assets – Temporary Investments) | 0.26 | 0.26 |
| Commitment to total loans | 0.19 | 0.24 |
Liquidity risk management includes static and dynamic liquidity gap monitoring, funding concentration monitoring and scenario-based stress testing (minor, moderate and severe). Stress scenarios included institutional deposit outflows of up to 40% to evaluate NII resilience and inform contingency actions. CBSL behavioural assumptions were applied in modelling to strengthen consistency and comparability of results.
Contingency planning includes identifying available liquidity buffers, secured funding options, and operational playbooks for stress conditions. Governance ensures that early warning signals and threshold breaches trigger timely escalation and action, including balance sheet repricing, funding diversification or temporary limits on growth in certain asset classes where necessary.
Liquidity and Funding Dashboard – 2025
What changed in 2025:
Liquidity remained well above regulatory minima, supported by strong buffers and disciplined monitoring. Funding resilience benefited from stable market conditions and stronger FX inflows from tourism and record remittances, while stress testing continued to assess resilience under severe deposit outflow scenarios. Currency depreciation towards year-end reinforced focus on FX liquidity, concentration monitoring and contingency readiness.
Stress testing – key assumptions:
- Scenarios: Minor/Moderate/Severe
- Deposit outflows: Institutional up to 40%
- Behavioural assumptions: CBSL/internal parameters
- Metrics tracked: LCR, NII resilience
- Contingency actions: Liquid assets, pricing, funding lines
Operational risk (including fraud, outsourcing and business continuity)
Operational risk is defined as the potential for loss resulting from inadequate or failed internal processes, people, and systems, or from external events. It encompasses fraud, legal risk, and the operational complexities of third-party and outsourcing relationships.
The Bank manages this profile through a robust governance framework, policies, and a suite of integrated tools, including RCSA, incident and loss event reporting, and KRIs. These are further strengthened by thematic reviews and structured remediation tracking to ensure continuous improvement. Additionally, the Bank strategically utilises insurance as a risk transfer mechanism to mitigate the impact of specific high-severity events.
2025 operational performance
ORRs of business units were introduced to proactively identify control gaps and accelerate remediation to mitigate risk arising from the Operational processes. Operational losses remained low at 0.132% of the last three years’ average gross income, with a majority of financial impact losses attributable to Retail Banking (high-frequency, low-impact events in cash handling and ATM operations), reinforcing continued focus on control enhancements in high-volume environments.
Composition of losses - 2025 Graph – 52
IT operational incidents are managed through a structured incident management framework supported by an IT Service Management (ITSM) tool implemented in November 2025. The tool supports consistent recording, impact assessment, root cause analysis and tracking of corrective/preventive actions, with periodic reporting and oversight through relevant management committees.
From a DR/BCP perspective, incidents with potential or actual service disruption are assessed against Recovery Time Objectives (RTOs), and observations (including deviations) are periodically reported by the IT Risk Unit to management to strengthen resilience.
Issues identified are communicated to relevant stakeholders, action plans are agreed, and closure is monitored through governance channels.
Business continuity and disaster recovery:
Operational resilience is anchored by robust business continuity planning, rigorous testing, and the diligent oversight of RTOs for critical services. Significant progress has been made toward ISO 22301 certification, with the Stage 2 audit slated for early 2026. Notably, Commercial Bank stands as the only bank in Sri Lanka to have maintained all critical operations from its IT Disaster Recovery (DR) site for over six months, far exceeding the CBSL seven day minimum requirement.
Technology and cyber risk
The continued expansion of the Bank’s digital footprint has led to a corresponding increase in technology and cyber risks. These risks include system availability issues, cyber security threats, change management weaknesses, data security exposures, and reliance on third-party technology providers. Given the potential for rapid and material impact on customers, operations, and the Bank’s reputation, the Bank maintains a low tolerance for cyber incidents and critical system disruptions.
All IT incidents are reported to the EIRMC and the BIRMC for review, following the completion of a comprehensive risk analysis. This analysis includes root cause assessment and recommendations to prevent recurrence, thereby strengthening overall oversight and control effectiveness, and is monitored through KRIs with a primary focus on cybersecurity risks and the availability of critical systems.
In addition, all new IT initiatives are submitted to the Board Technology Committee for approval, while all initiatives followed comprehensive system development lifecycle covering the Technology risk perspective.
Detection and response maturity
At present, privileged user activities are proactively monitored and detected using Privileged Activity Monitoring (PAM) tools. In addition, a phase 1 of centralised MSOC was implemented in the later part of 2025 with the plan of strengthening the real-time threat detection and incident response across critical systems and digital channels by 2026. Further, the IT Risk Management Policy (v3.0) has been comprehensively revamped to enhance coverage of cybersecurity risks.
Incident governance
A structured incident management framework, supported by an ITSM tool, ensures consistent incident logging, root cause analysis, and implementation of corrective and preventive actions. Incident remediation progress are periodically reviewed and escalated to relevant governance forums, as appropriate.
Assurance and standards
ISO/IEC 27001:2022 and PCI DSS certifications were achieved in 2025, strengthening assurance over information security and payment environments.
Proposed Operating Model of the Managed Security Operations Centre
SOC operating cycle (continuous improvement) Figure – 73

During 2025, the Bank successfully completed Phase 1 of the MSOC implementation. This phase involved deploying enhanced SOC capabilities, specifically incorporating Security Information and Event Management (SIEM) and Extended Detection and Response (XDR). Furthermore, this deployment included External Attack Surface Monitoring (EASM), Threat Intelligence (TI), and Threat Hunting (TH) within the Bank's operations, leading to a capability enhancement to 24x7x365 security monitoring.
For Phase 2, the Bank plans to expand this capability to its overseas operations and integrate Security Orchestration, Automation, and Response (SOAR). This expansion and integration will further enhance operational resilience and stability by strengthening the overall security and risk management posture.
Compliance, Reputation, conduct and regulatory risk (including data privacy)
Compliance, Reputation and conduct risk arise from failure to comply with laws, regulations, internal standards and ethical expectations and potential negative impact arising from stakeholders’ perception of the Bank. Strong reputation, conduct and compliance protect franchise value and stakeholder trust and reduce the risk of legal and regulatory penalties.
Compliance governance includes independent monitoring, reporting to the Board, and periodic training to embed expectations across the organisation. Additionally, the implementation of the Group Reputational Risk Management Policy and the Group Conduct Risk Management Policy formalises the governance of reputational and conduct risks across the organisation, reinforcing a strong risk management culture and providing a structured framework for managing conduct risk while upholding high standards of behaviour and integrity.
AML/KYC and financial crime
The Bank remained steadfast in its commitment to preventing financial crimes by continuously strengthening its AML and KYC frameworks, enhancing monitoring technologies for timely detection and prevention of suspicious activities, and periodically reviewing controls to align with evolving regulatory and global AML expectations, thereby supporting compliance, mitigating financial crime risks, and reinforcing stakeholder trust in the Bank’s ethical practices.
Data privacy
As part of Bank's journey to becoming a financial leader in data privacy practices, the Bank has developed several policies and procedures to safeguard the processing of customer data in compliance with the Personal Data Protection Act No. 09 of 2022 of Sri Lanka. A series of training programs were also conducted to enhance staff awareness on the proper handling of personal data.
Environmental & Social (E&S) Climate Risk
E&S and Climate Risks can affect borrower viability, collateral values and operational continuity. Expectations for governance, integration and disclosure continue to rise for banks and financial institutions.
In 2025, climate risk and broader E&S risks were integrated into ICAAP and the enterprise risk management framework. This supports forward-looking assessments of potential portfolio vulnerabilities and strengthens governance as disclosure requirements evolve towards global standards such as SLFRS S1 and S2.
Key focus areas included governance clarity, exposure mapping (for example, climate-sensitive sectors), risk identification in credit processes, scenario analysis capability, and robust internal controls over climate-related data and disclosures.
E&S and Climate Risks Integration (2025 Progress and Forward Outlook)
Table – 96
| Area | Policies/standards and Processes | Data and tools | Governance/oversight | Metrics and disclosures |
| ICAAP and capital planning | ENHANCING E&S and Climate Risks considerations integrated into ICAAP scorecards, including structured risk identification and assessment of potential financial impacts. |
PLANNED Scenario analysis methodologies and portfolio-level climate risk indicators under development to support forward-looking risk assessment. |
EMBEDDED Oversight provided by the BIRMC within the established governance framework, with clear accountabilities across management and the three lines of defense. |
ENHANCING Qualitative disclosures established; quantitative metrics and scenario-based insights to be progressively implemented. |
| Credit assessment and underwriting | ENHANCING E&S and Climate Risk factors are systematically embedded into credit appraisal, due diligence, and credit approval processes, including comprehensive borrower-level risk assessments. Climate risk frameworks are being enhanced to explicitly reflect climate transition and physical risk considerations. |
ENHANCING Expanding the use of geographic and sector vulnerability heat maps, risk screening checklists, and external data sources to support credit decision-making. |
EMBEDDED Well-defined threshold limits are established to oversight through EIRMC and Risk Management functions, with escalation mechanisms for higher-risk exposures. |
PLANNED Initial qualitative disclosures are in place; development of consistent portfolio-level metrics planned |
| Collateral and valuation | PLANNED Enhancements underway to assess climate-related impacts on collateral values, particularly physical risk exposures. |
ENHANCING Tools and data sources are being strengthened to assess location-based physical risks exposures and long-term asset vulnerability |
ENHANCING Arrangements are ongoing to support the current automation of collateral valuation project. |
PLANNED Metrics and disclosures are being under development, with a focus on material collateral classes/types |
| Stress testing | PLANNED Climate-related physical and transition risk assessments are being progressively integrated into enterprise-wide stress testing frameworks |
PLANNED Models, scenarios, and data inputs are being enhanced to support multi-year climate stress testing |
EMBEDDED Stress testing oversight is embedded through Board and management committee structures, supported by clearly defined delegated responsibilities. |
PLANNED Stress testing matrices will be implemented as planned, with methodologies expected to progressively mature going forward. |
| Disclosure controls |
ENHANCING Processes are being strengthened to ensure the consistency, accuracy, and completeness of E&S and Climate Risk disclosures. Policies are being enhanced to align with SLFRS S2 disclosure requirements and other emerging global sustainability reporting standards. |
ENHANCING Data management systems and controls are being enhanced to support reliable, auditable climate-related data/information |
EMBEDDED Oversight embedded through BAC |
ENHANCING Qualitative and quantitative disclosures are progressively incorporated in line with regulatory and stakeholder expectations. |
For a more detailed account of E&S and Climate Related Risks and Opportunities, please refer SLFRS Sustainability Related Financial Disclosures on pages 141 to 171.
Model risk, data and analytics
As the Bank expands the use of analytics and AI-driven tools, model governance and data quality become critical to reliable decision-making and regulatory confidence. Model risk arises from potential errors in model design, implementation, data inputs, assumptions or misuse of outputs.
In 2025, the Bank developed an AI and ML Governance Policy to guide responsible, secure and ethical use of AI/ML tools across business areas. This helps ensure that model outputs are used appropriately, with clear accountability, transparency and controls over data access and outcomes.
To strengthen the reliability of analytics and reporting, a Data Quality Policy was implemented covering data quality dimensions and metrics, alongside roles and responsibilities for data owners, data stewards and data custodians. Risk data initiatives such as repositories and data marts support more consistent reporting and control evidence.
Data governance “golden thread”
Table – 97
| Roles and accountability: | Critical data elements: |
Data quality KPIs: |
Dashboards and monitoring: |
Decisions and outcomes: |
| Data Owners (define/approve) Data Stewards (quality and controls) Data Custodians (storage and access) |
Owners for the data assets are being defined Definitions for critical data elements are being defined in the ‘Data quality Policy’ |
The following quality standards have been defined Error rate 0% – 5% Completeness ≥ 90% Timeliness ≥ 90% |
Data Quality Scorecard: Monthly report on data quality exceptions (e.g., missing mandatory fields, format errors) by business unit. Access Control Log Monitoring: Daily review of privileged user access to production databases and sensitive file shares. |
Better Risk Decisions: Accurate calculation of ECL based on validated customer and transactional data. Regulatory Reporting: Timely and accurate submission of all mandated reports to the Regulatory authorities. Portfolio Monitoring: Granular and consistent data enables accurate tracking of loan portfolio health and early warning indicators. |
|
Data Governance Framework |
||||
| Policy: | Standards: | Processes: | Tools: | Reporting: |
| Data Governance Policy Data Breach Handling Policy Data Quality Policy AI & ML Model Governance Policy | Mandatory use of single source of truth for all new projects and reporting initiatives. Minimum standards for data quality are being defined Developments of AI and ML models must ensure reliability, trustworthiness and responsible use of data Minimum standards for model performance metrics are being defined |
All data requests require Data Protection Officer (DPO) approval in accordance with Personal
Data Protection Act (PDPA) requirements
Data Protection Impact Assessment (DPIA) is in place to identify and reduce privacy risks when processing personal data Data Quality Monitoring: Automated daily checks on critical data elements (CDEs) within the core banking system. DLP controls are in place to secure confidential data from being leaked to unauthorised parties Data breach handling procedures are established in the event of a personal data breach The BIRMC approves AI and ML models prior to development considering the pre-risk assessment and the final approval based on the post risk scores |
Data Validation Tools: Verify performance, robustness and fairness of the model DLP tools To block and monitor unauthorised sharing of personal and confidential non-customer data. |
Committee Packs: Quarterly reports to the Board on overall data quality maturity and compliance with PDPA/CBSL directives. |
Stress testing and enterprise resilience
Stress testing supports forward-looking risk management by assessing the impact of severe-but-plausible shocks and by informing risk appetite, capital planning, limit calibration and contingency actions. It is an important element of ICAAP and broader enterprise resilience.
In 2025, stress tests incorporated credit default scenarios (including large exposure failure), market and FX shocks, extreme funding crunch conditions, severe interest-rate shocks and operational/cyber disruption events. Combined multi-factor scenarios were also used to assess resilience under concurrent stresses.
Stress test results are used to confirm adequacy of capital and liquidity buffers, identify vulnerabilities, and trigger management actions such as rebalancing of portfolios, adjustments to funding strategy, limit calibration, and strengthening of operational resilience measures.
Capital adequacy and ICAAP
ICAAP provides a structured assessment of the Bank’s capital needs over a multi-year horizon and supports proactive capital planning in line with strategy and risk appetite. It considers material risks, stress test outcomes and forward-looking business plans.
As at 31 December 2025, the Bank reported a Tier 1 capital ratio of 13.035% and a total capital ratio of 16.698%, both above regulatory minimums. Capital planning was supported through debenture issuance and risk-weighted assets optimisation initiatives, alongside profitability and disciplined balance sheet growth.
Targeted and actual capital adequacy ratios
Table – 99
| As at December 31, | 2025 | 2024 | ||
| Capital ratios |
Regulatory minimum % |
Goal (internal requirement) % |
% | % |
| CET 1 | 8.500 | >8.500 | 13.035 | 14.227 |
| HLA | 1.500 | >1.500 | ||
| Tier I | 10.000 | >10.000 | 13.035 | 14.227 |
| Total | 14.000 | >14.000 | 16.698 | 18.142 |
Strong capital adequacy supports stakeholder confidence and enables the Bank to invest in strategic priorities such as technology resilience, data foundations and sustainable finance capabilities, while maintaining flexibility to support customer needs.
Impact on CAR at minor, moderate and severe stress levels
Table – 98
| As at December 31, | 2025 | 2024 | |||||
| Particulars | Description | Minor | Moderate | Severe | Minor | Moderate | Severe |
| % | % | % | % | % | % | ||
| Credit risk – asset quality downgrade | Increasing the direct non-performing facilities over the direct performing facilities for the entire portfolio | -0.35 | -0.85 | -2.21 | -0.39 | -0.94 | -1.51 |
| Operational risk | Impact of; Top five operational losses during last five years Average of yearly operational risk losses during last three years whichever is higher | -0.02 | -0.05 | -0.09 | -0.03 | -0.07 | -0.15 |
| Foreign exchange risk | Percentage shock in the exchange rates for the Bank (gross positions in each Book without netting) |
-0.02 | -0.04 | -0.06 | -0.18 | -0.22 | -0.34 |
| Liquidity risk (LKR) – | Withdrawal of percentage of the clients, banks and other banking institution deposits from the Bank within a period of three months Rollover of loans to a period greater than three months | -0.05 | -0.12 | -0.21 | -0.18 | -0.43 | -0.75 |
| Interest rate risk – EAR and EVE (LKR) – Sri Lanka |
To assess the long-term impact of changes in interest rates on Bank’s EVE through changes in the economic value of its assets and liabilities and to assess the immediate impact of changes in interest rates on Bank’s earnings through changes in its net interest income | -0.06 | -0.13 | -0.18 | -1.42 | -2.16 | -6.25 |
(1) Stress scenarios are based on SLFRS-9 guidelines and staging of credit facilities pursuant to the Banking Act Direction No. 13 of 2021.
Outlook and priorities for 2026
Looking ahead, the Bank’s 2026 risk priorities will be closely aligned to the 2026–2030 strategic direction and the evolving risk landscape, with a focus on strengthening sustainable growth, digitisation and organisational resilience.
Key priorities include:
- Strengthening capital, liquidity and risk-adjusted performance frameworks by optimising buffers and deepening the use of RAROC and ICAAP in line with market developments, while continuing to maintain portfolio quality within the Bank’s approved risk appetite.
- Scaling digitisation and value-added risk services, including transforming selected components of the credit risk review function, streamlining pre - and post-credit evaluation processes, and embedding a Risk Insight and Early Warning mechanism that provides granular, timely risk insights through digital platforms.
- Industrialising AI and model governance by strengthening model lifecycle controls, validation, monitoring and evidence trails, while leveraging AI-driven analytics and automation to enhance the efficiency, accuracy and scalability of Level-2 monitoring, reducing reliance on manual intervention.
- Advancing cyber maturity and operational resilience through completion of MSOC implementation and increased automation of monitoring, alongside enhanced capabilities for continuous monitoring, threat hunting and vulnerability management, and stronger third-party/outsourcing controls.
- Delivering data foundations (risk data repository/data marts) and strengthening data quality KPIs and dash boarding to support better analytics, consistent risk reporting and regulatory compliance.
- Deepening E&S and Climate Risks integration through a more data-driven climate risk assessment process, enhanced scenario capability and disclosure readiness aligned to emerging standards, supported by stronger governance and controls.
- Strengthened Group wide oversight of subsidiaries, related-party entities, and foreign operations through enhanced consolidated risk reporting and governance, harmonised control standards and risk appetite translation, and reinforced escalation and assurance over cross border exposures, concentrations, related party transactions, and operational resilience.
- Talent optimisation and culture through a structured succession plan, targeted upskilling and stronger alignment around shared accountability, building the capabilities required to operate as a more centralised, consultative risk function over time.
Collectively, these priorities strengthen value creation by improving decision quality and speed, reducing leakage through losses, protecting customer and stakeholder trust, and enabling sustainable, risk-adjusted growth.